Unified Track turns the counselor's daily work into the district's recovered revenue – automatically, and inside every rule that governs it.
Enter your district size and current attendance rate. We'll show you the ADA revenue your district is leaving on the table right now.
Estimated statewide ADA exposure, this school year
Not sure? Statewide average is roughly 94%. Your SARC or Aeries dashboard has your exact rate.
Sets the blended per-ADA rate. Blended rate: $11,431/ADA
Estimates use 2025-26 LCFF base grant rates and exclude supplemental and concentration grants. Your actual exposure depends on your grade-span mix, UPP, and attendance patterns. For districts with high unduplicated pupil percentages, actual exposure is 20-35% higher.
This is an estimate. Your Aeries data has the real number.
In 20 minutes, we'll pull your actual P-2 ADA and show you exactly what's recoverable this year.
See exactly how many students it takes to pay for the platform - and the funding you keep after.
Tap a grade span to model its funding.
A chronically absent student misses ~10% of the year. Every school day the platform brings them back is worth one day of ADA funding the district keeps.
You break even after just 8 of those 17 students - everything beyond that is funding the district keeps. At 1 school, that’s $8,079 in net recovered funding.
Recovered funding = students × recovered attendance days × ADA daily rate, per school. ADA rates from California LCFF (2025–26), ~180 instructional days. Illustrative model for planning.
Enter your district size and current attendance rate. We'll show you the FSP revenue your district is leaving on the table right now.
Statewide TX average is roughly 93%. Your TEA PEIMS submission has your exact rate.
Estimates use the Texas 2025-26 Basic Allotment ($6,160/ADA, post-HB 2) and exclude Small/Mid-Sized District, transportation, CCMR outcomes bonus, and other weighted allotments. Actual exposure depends on your district's specific FSP formula weights. For districts with high compensatory education or SPED weights, actual exposure is typically 15-30% higher.
This is an estimate. Your Skyward or Frontline data has the real number.
In 20 minutes, we'll pull your actual PEIMS ADA and show you exactly what's recoverable this year.
See exactly how attendance and CCMR improvements translate to recovered funding.
In Texas, funding follows attendance - not just enrollment.
Texas pays districts on attendance. Every point of attendance recovered is real ADA - and the students you keep on track become CCMR-ready graduates that earn bonus funding on top.
The platform covers its cost with the first 5 recovered ADA - about a 0.20% attendance lift. At this campus that's $284,400 in net new funding, before CTE, P-TECH, and other allotments.
Base = recovered ADA × $6,160 conservative Basic Allotment (TEC Ch.48). CCMR = added ready grads above subgroup thresholds × $5,000 (econ. disadv.) / $3,000 (non-disadv.). Excludes Tier 2, CTE, P-TECH, special-population weights, transportation, and local-share/recapture effects — actual impact is typically higher. Illustrative model for planning.
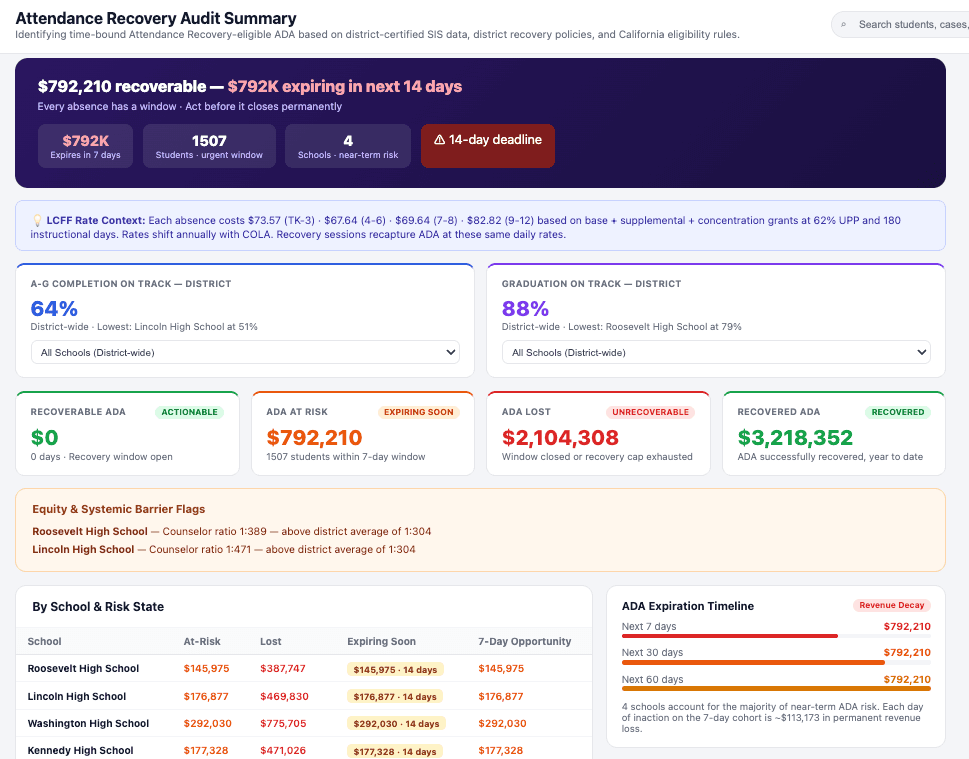
Eight steps connect a single absence to a documented, reported, recovered dollar – the same pipeline the counselor already works every day.
Measured impact tells you which outreach actually returned students to seats, so the next cycle starts with better priorities instead of starting over.
Recovery windows are not unlimited. Program requirements, annual limits, reporting timelines, and fiscal-year boundaries all matter. Unified Track surfaces the actionable opportunities while there's still time to act.
Find the opportunity before the window closes.
No separate finance workflow. Every intervention a counselor logs is the documentation the state rules engine needs to recover the dollar.
The home call, check-in, or plan step is recorded as part of the normal worklist — no separate finance workflow.
Documentation is checked against current California and Texas funding rules automatically.
Validated interventions become reported funding, tracked from actioned to recovered.
Every recovery opportunity is checked against current state funding rules before it ever reaches a counselor's worklist.
California Attendance Recovery generally limits a student to the lesser of 10 recovered days or the student's actual absences during the fiscal year.
Recovery can be offered before or after school, on weekends, and during qualifying intersession periods.
Participation and instructional time must meet state requirements and be documented appropriately.
Recovery can generate ADA but does not erase the original absence from the student's attendance history.
Rules shown are illustrative of current state guidance and are kept current automatically inside the product.
Validation checks against current California and Texas funding code, applied automatically on every sync.
Which opportunities are time-sensitive, and exactly what's approaching expiration before the dollars are gone.
Every funding opportunity tied back to the actual student and the intervention it requires.
Funding exposure: Dollars at risk by school, grade, student, and attendance code.
Recoverability: Which absences can actually generate recoverable ADA.
Action routing: The next action lands with the right owner, every time.
Evidence trail: Interventions and documentation captured for audit.
Recovered revenue: Track what's moved from at risk to actioned to recovered.
Board-ready reporting: Student impact and financial impact, together.
A 30-minute walkthrough using your district's own attendance and funding numbers.
We'll send a personalized one-page review of where students are falling through the cracks, and the funding you can recover by re-engaging them. Within two business days.
No calendar link, no obligation. We reply by email.
Pick a time that works. We'll walk you through your district's exposure analysis and answer procurement questions on the call.